- 개인 프로젝트 - Bit Coin Chart App 만들기_#1
- 개인 프로젝트 - Bit Coin Chart App 만들기_#2
- 개인 프로젝트 - Bit Coin Chart App 만들기_#3
앱 / 웹을 개발할 시 UI 디자인은 빠지면 안돼는 존재이다.
리액트 네이티브에 적용할 수 있는 UI 컴포넌트는 여러가지가 있다.
그 중 가장 편하게 사용할 수 있는 Native Base를 사용해서 앱을 만들기로 했다.
Native Base (네이티브 베이스)
네이티브 베이스는 React Native 와 Vue Native를 위한 오픈소스 UI 컴포넌트 라이브러리이다. 동일한 코딩으로 Android와 iOS에 유사한 스타일로 표현할 수 있는게 장점입니다.
설치하기
네이티브 베이스 설치는 다음 명령어를 통해 설치 할 수 있다.
// npm
npm install native-base --save

// yarn
yarn add native-base주의: 리액트 버전이 0.60 이하의 경우 다음 명령어를 실행한다.
react-native link예제 코드
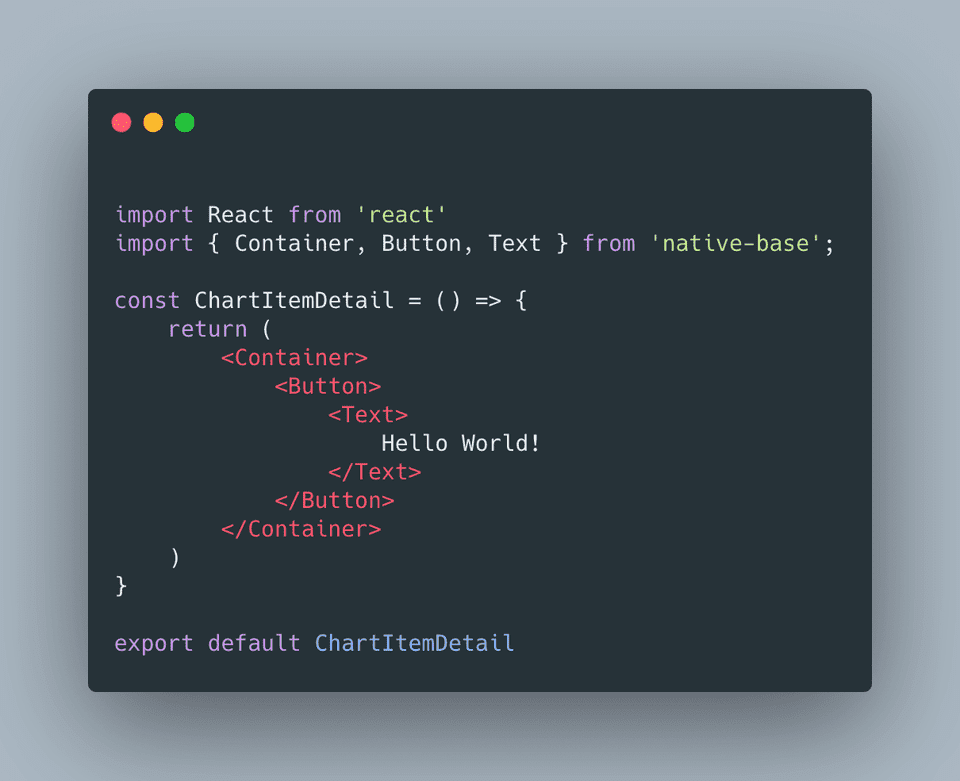
이제 이전에 비트코인 리스트를 가져왔던 코드에 네이티브 베이스를 접목시켜 디자인(?)을 해보자.
우선 앱의 헤더부분과 바디부분으로 나누어 헤더부분에는 앱의 이름, 현제 뷰의 명칭(메인 화면인 경우 메인) 등을 표시해서 보여주지만… 딱히 표시할 내용이 없어서 현재 시간을 보여주기로 했다.
직접 시간 변환하는 건 너무 귀찮으니 moment.js 날짜/시간 관련 라이브러리를 사용해서 간편하게 표시한다.
비트코인 정보를 가져오는 API 통신은 Redux에서 관리 할 수 있도록 작성 했다.
| const MainScreen = () => { | |
| const dispatch = useDispatch(); | |
| const { status, charts, date, error, loading } = useSelector( | |
| ({ bitCoinCharts, loading }) => { | |
| const { datas, error, status } = bitCoinCharts; | |
| let charts = []; | |
| let date = moment().format('lll'); | |
| if (datas) { | |
| Object.keys(datas).map(element => element !== "date" && charts.push({ symbol: element, data: datas[element] })); | |
| // date = moment(datas.date).format('LLLL'); | |
| date = moment(parseInt(datas.date)).format('lll'); | |
| } | |
| return ({ | |
| status, | |
| error, | |
| charts: charts, | |
| date, | |
| loading: loading['bitCoins/GET_BIT_COINS_CHART'] | |
| }) | |
| } | |
| ) |
추후 Redux에 관련된 포스트를 작성하겠다.
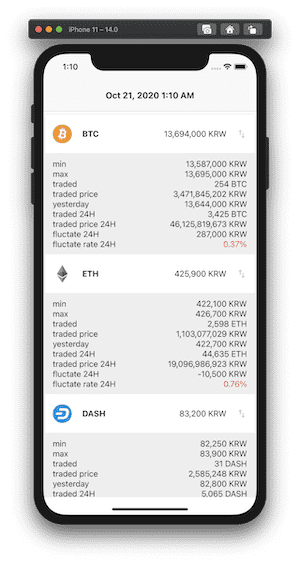
디자인은 네이티브 베이스의 Card List를 사용했다.
| return ( | |
| <Container> | |
| <Header> | |
| <Body> | |
| <Title>{date}</Title> | |
| </Body> | |
| </Header> | |
| {!loading && charts && ( | |
| <Content> | |
| <Card> | |
| {charts.map((chart, index) => ( | |
| <ChartItem chart={chart} key={index} /> | |
| ))} | |
| </Card> | |
| </Content> | |
| ) | |
| } | |
| </Container > | |
| ) |
| return ( | |
| <View> | |
| <CardItem bordered button onPress={() => setVisibility(!visibility)} style={{ flexDirection: "column" }}> | |
| <CardItem style={{ marginLeft: -15, marginRight: -15 }}> | |
| <Thumbnail source={_symbol.img} small style={styles.thumbnail} /> | |
| <View style={styles.symbol}> | |
| <View style={styles.header}> | |
| <Text style={styles.title}>{symbol}</Text> | |
| <Text style={styles.price}>{parseInt(data.closing_price).toLocaleString()} KRW</Text> | |
| </View> | |
| </View> | |
| <Right style={styles.right}> | |
| <Icon type='MaterialIcons' name='swap-vert' /> | |
| </Right> | |
| </CardItem> | |
| </CardItem> | |
| { | |
| visibility && <ChartItemDetail symbol={symbol} data={data} /> | |
| } | |
| </View> | |
| ) | |
| } |
ChartItem.js의 37번째 줄 ChartItemDetail은 상세정보를 볼 수 있게 만든 컴포넌트이다.
실행 화면
Github
해당 프로젝트의 Github 주소는 다음과 같다.
https://github.com/Hong-mae/bit_chart
디자인 조금 더 수정하고… 다음 프로젝트는 뭐하지?

